HeatSync
Real-time system monitoring for Windows, with a Linux AppImage for good measure. Built because I got tired of opening five apps to check if my GPU was throttling.
v1.0.79
Python 3.10+
Windows + Linux
MIT License
Real-time system monitoring for Windows, with a Linux AppImage for good measure. Built because I got tired of opening five apps to check if my GPU was throttling.
In Action
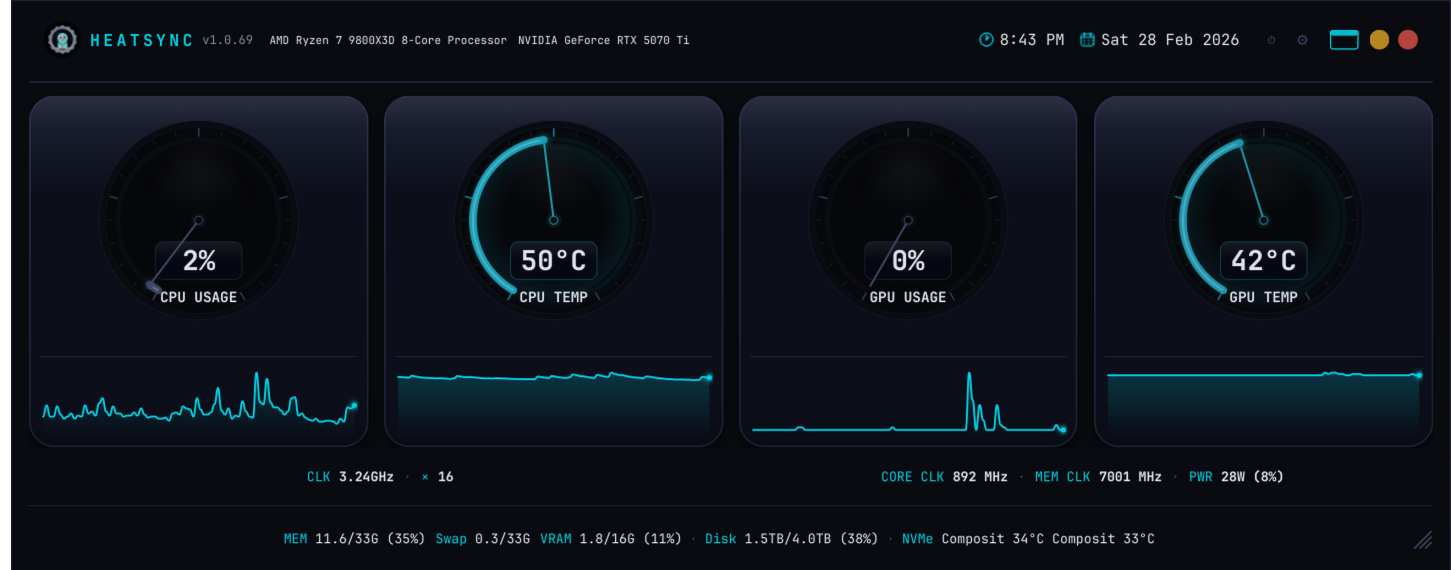
Docked Mode — Full-Width System Bar
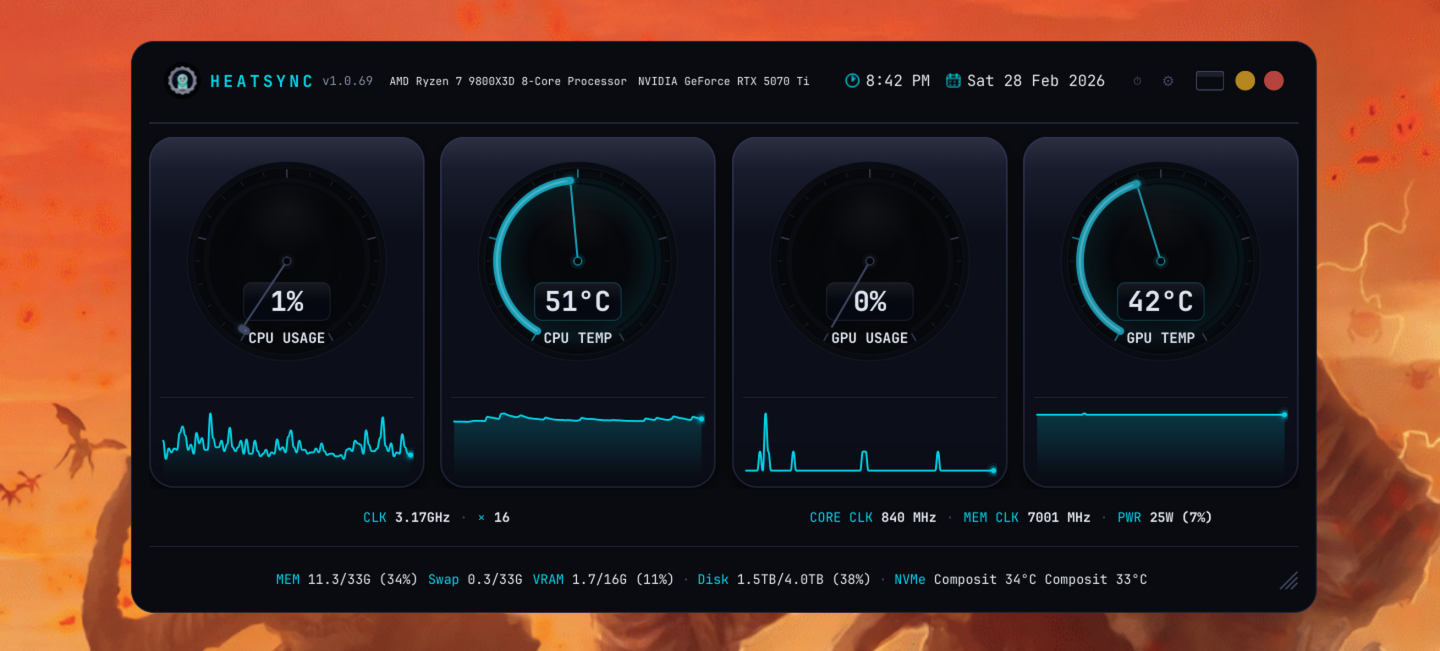
Standard View — Under Load

Compact Mode — Minimal Footprint
What It Does
Everything you need to know about your system, nothing you don't.
CPU usage, CPU temp, GPU usage, GPU temp — four animated arc gauges with 300-degree sweep. Color shifts from white to orange to red as temps climb.
90-point rolling graphs under each gauge. Plus a full 3600-point history window you can export as PNG whenever you need proof your GPU hit 90 degrees.
Per-metric thresholds with tray notifications. 5-minute cooldown so it's not nagging you. Triggers after 10 consecutive readings, not random spikes.
Dark, Synthwave, Dracula, Nord, AMOLED, and more. Switch from the settings menu. Because a system monitor should look as good as your desktop.
Optional CSV or NDJSON logging with configurable retention. Auto-flushes every 60 seconds. Great for tracking thermals over time or proving your case for a new cooler.
Double-click to snap to the top edge as a full-width bar. Or switch to compact mode — one slim line with all key stats. Adjustable opacity, always-on-top, position memory.
Optional per-core CPU breakdown and fan RPM display. Network upload/download in Mbps. Battery gauge for laptops. NVMe temps in the status bar.
Save and load entire configurations as presets. Theme, gauges, opacity, refresh rate, alerts — everything. Switch between setups instantly.
One-line install via winget on Windows, AppImage on Linux. First launch creates a desktop shortcut and enables autostart. Detects your GPU automatically.
Under The Hood
| GPU | Driver | Notes |
|---|---|---|
| NVIDIA | pynvml | Requires nvidia-utils |
| AMD | amdgpu sysfs | No extra drivers needed |
| Intel Arc / iGPU | xe / i915 sysfs | No extra drivers needed |
| Windows (non-NVIDIA) | WMI | Basic stats via Windows Management |